Weekly Market Commentary | December 9th, 2024
Week in Review…
The market extended its gains, with the S&P 500 and Nasdaq reaching new all-time highs after a solid week of economic data that boosted confidence that the economy remains on strong footing, and is not running too hot to deter the Federal Reserve (Fed) from lowering its rate in December.
- The S&P 500 rose +0.71%
- The Dow Jones Industrial Average was down -0.03%
- The tech-heavy Nasdaq finished up +2.35%
- The 10-Year Treasury yield ended the week at 4.149%

This week, key economic data revealed mixed signals about the U.S. economy. The Manufacturing Purchasing Managers’ Index (PMI) for November increased to 48.4 from October’s 46.5, exceeding expectations of 47.7. While still below the critical 50-point threshold, which separates contraction from expansion, the uptick suggests a slower pace of decline in manufacturing activity. Conversely, the ISM Services PMI fell to 52.1 from 56.0 in October, indicating the services sector continues to grow but at a reduced rate.
Labor market indicators were a focal point, with the Job Openings and Labor Turnover Survey (JOLTS) report surprising markets. October’s job openings rose to 7.7 million, up from 7.4 million in September, signaling persistent demand for labor despite higher interest rates. Initial jobless claims also pointed to labor market resilience, coming in at 224,000 for the week, which is in line with normal market level. In addition, the nonfarm payrolls report also surprised the market with it adding back 227,000 jobs in November, compared to 36,000 the month prior. The increase is largely due to workers sidelined by storms getting back on the job, and thousands of striking Boeing employees returned to work.
Federal Reserve Chair Jerome Powell’s comments this week emphasized the Fed’s data-driven approach to monetary policy. He highlighted that the current state of the economy is stronger than the Fed has projected, and it is too soon to say how policy changes from the new administration might reshape the outlook for economic activity and interest rates. The Fed’s next meeting is December 17-18. Investors in interest-rate futures markets are currently pricing in a roughly 80% chance of a 25 bps rate cut and 20% chance of no cut, according to the CME Group.
Spotlight

The Trump Effect on Factors
Since the election, equities have continued to rally higher as investors analyze the impact of a second Trump term. However, underneath the surface, there has been a shift in the types of companies that investors are betting on. This week, we take a look at how the market has adjusted their equity position within factors in both the Russell 1000 and Russell 2000.


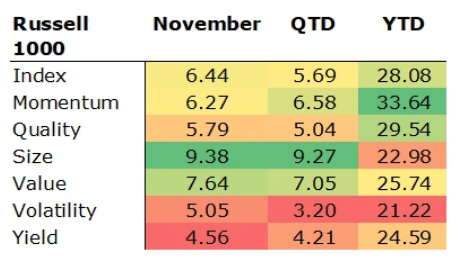
The Russell 1000 shows a strong year-to-date (YTD) return of 28.08%. The Momentum factor outperforms with a YTD return of 33.64%, indicating that high-momentum stocks lead the gains, while the Volatility factor underperforms with a YTD return of 21.22%. For the quarter-to-date (QTD) period, the Momentum factor again outperforms with a 6.58% return, while the Volatility factor lags with a 3.20% return.
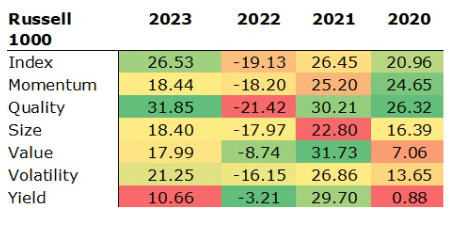
In November, the Size factor saw the highest gain at 9.38%, significantly outperforming the broad index’s 6.44% gain. This recent surge in the Size factor may be attributed to the impact of tariffs, which have made smaller large-cap stocks more attractive due to their lower exposure to international trade and supply chain disruptions. Meanwhile, the Yield factor has the lowest November return at 4.56%, highlighting the impact of higher rates on dividend stocks. The notable change in November, with the Size factor outperforming, contrasts with the broader trends observed over the past four years indicating a potential broad investor shift away from the larger names in the index.


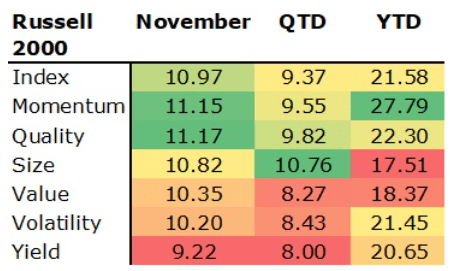
The Russell 2000 shows a solid YTD return of 21.58%. The Momentum factor outperforms with a YTD return of 27.79%, indicating that high-momentum stocks lead the gains, while the Size factor underperforms with a YTD return of 17.51%. For the QTD period, the Quality factor outperforms with a 9.82% return, while the Value factor lags with an 8.27% return.
In November, the Quality factor saw the highest gain at 11.17%, slightly outperforming the broad index’s 10.97% gain. Meanwhile, the Yield factor has the lowest November return at 9.22%, a similar trend seen in large caps. The strong performance of the Momentum factor could be attributed to investors flocking into the asset class broadly post-election. The recent outperformance of the Quality factor may be due to investors rotating into small-cap stocks broadly post-election, driven by expectations of lower taxes, increased domestic production, and potential benefits from a U.S.-first policy.
Overall, we have seen a broad shift away from mega-cap stocks to small-to-medium size quality companies that are isolated from international trade and have the capacity to handle both higher rates and will benefit from lower taxes. If Trump’s proposed tariffs and economic policies come to reality in 2025, we could potentially continue to see small, quality companies outperform larger multi-nationals.
Week Ahead…

The headline event next week will be the release of the November Consumer Price Index (CPI) data. Core CPI, which excludes volatile food and energy prices, is closely watched by the Federal Reserve as a key indicator of underlying inflation. By focusing on this metric, policymakers can better gauge price pressures and make informed decisions about monetary policy.
Markets expect November’s Core CPI to align with October’s 0.3% increase. Any significant deviation from this forecast could cause market volatility as investors adjust their expectations for potential policy actions and economic outcomes.
Tuesday will bring two reports that will provide further insights into the labor market and its relationship with inflation.
- Nonfarm Productivity measures the annualized change in labor efficiency. Higher productivity can lead to higher wages without fueling inflation. Given the recent strong job growth, increased efficiency could help alleviate inflationary pressures.
- Unit Labor Costs measure the annualized change in labor costs for businesses. This is a leading indicator of consumer inflation. As such, the market will closely watch this report to gauge how recent job market strength will translate into price pressures.
Additionally, the 10-year Treasury note auction on Wednesday will be significant. The 10-year note plays a crucial role in pricing 30-year mortgages and long-term inflation expectations. Auction results will give markets an opportunity to see how recent economic data, particularly the strong job market, is being priced into the long end of the curve.
This content was developed by Cambridge from sources believed to be reliable. This content is provided for informational purposes only and should not be construed or acted upon as individualized investment advice. It should not be considered a recommendation or solicitation. Information is subject to change. Any forward-looking statements are based on assumptions, may not materialize, and are subject to revision without notice. The information in this material is not intended as tax or legal advice.
Investing involves risk. Depending on the different types of investments there may be varying degrees of risk. Socially responsible investing does not guarantee any amount of success. Clients and prospective clients should be prepared to bear investment loss including loss of original principal. Indices mentioned are unmanaged and cannot be invested into directly. Past performance is not a guarantee of future results.
The Dow Jones Industrial Average (DJIA) is a price-weighted index composed of 30 widely traded blue-chip U.S. common stocks. The S&P 500 is a market-cap weighted index composed of the common stocks of 500 leading companies in leading industries of the U.S. economy. The NASDAQ Composite Index is a market-value weighted index of all common stocks listed on the NASDAQ stock exchange.
