
Weekly Market Commentary
September 28th, 2026
Week in Review
Business sentiment surged to multiyear highs while labor market data continued to improve. However, several hard economic indicators have yet to fully confirm the growing optimism, creating an increasingly important question for investors heading into the fourth quarter.
Business Sentiment: Optimism Builds, but Confirmation Is Needed
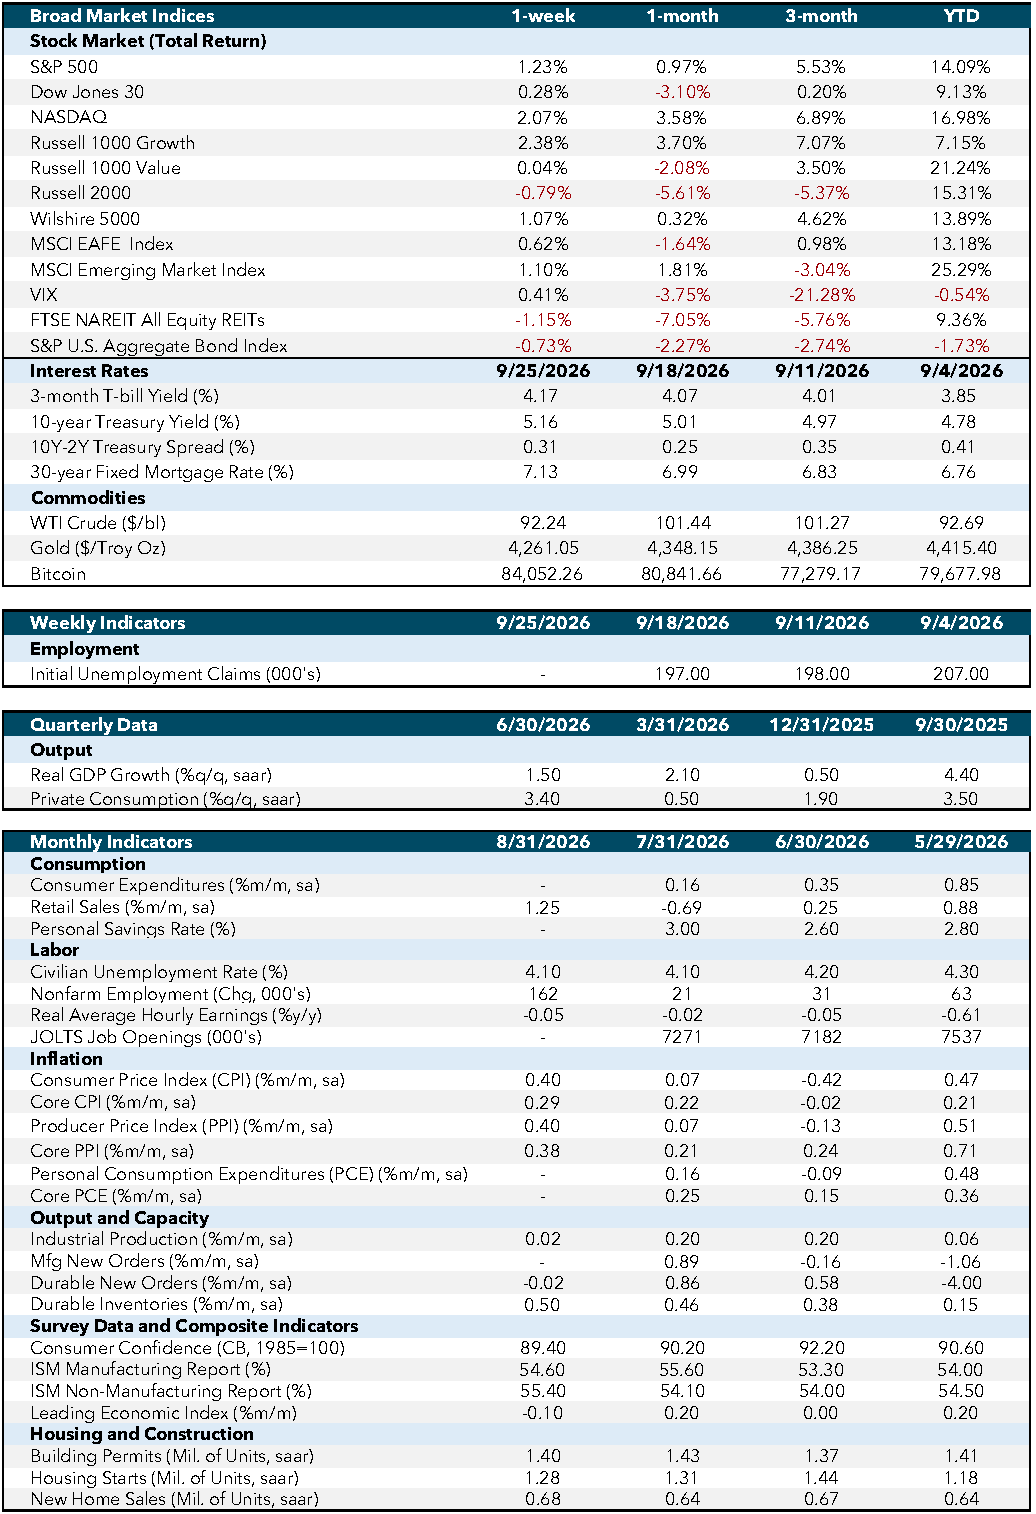
Preliminary S&P Global Purchasing Managers’ Index (PMI) data offered an unexpectedly strong view of business conditions. Manufacturing PMI rose to 57.0 from 53.9, marking a third consecutive upside surprise and its highest reading in more than four years. Services PMI strengthened to 58.7 from 56.5, reaching a multiyear high. Together, the reports suggest momentum may be broadening across the economy rather than remaining concentrated in one sector.
The strength in services is particularly important given the sector’s outsized contribution to economic activity. However, investors will likely temper their optimism because the reports are preliminary and subject to revision. Final readings will help determine whether September marked a genuine acceleration or an unusually strong initial sample.
Consumer data provided a useful counterweight. The University of Michigan’s Consumer Sentiment and Expectations indexes exceeded forecasts but declined from August, suggesting households remain more cautious than businesses. The divergence does not invalidate the PMI strength, but it indicates the improvement in confidence is not yet uniform across the economy.
Hard Data: Optimism Has Yet to Fully Translate
Housing and capital spending data painted a more measured picture. August’s building permits exceeded expectations (1.403 million versus 1.394 million) but declined from the prior month (1.433 million). The August reading was also broadly consistent with May, suggesting the sharp June decline and July rebound may have reflected monthly noise rather than a clear change in direction.
Core durable goods orders rose by just 0.3% versus the 0.6% expected, signaling that businesses have not yet translated stronger sentiment into equally strong capital spending. The timing of the reports may partly explain the disconnect. Still, markets will want to see hard activity strengthen before concluding that the recent PMI acceleration represents a durable change in momentum.
Labor Market: Claims Point to Greater Stability
Jobless claims remained constructive. Continuing claims fell to 1.730 million, below the 1.780 million forecast, marking a third consecutive better-than-expected reading and extending a broader decline from the summer’s higher levels.
Initial claims also fell below 200,000, while the four-week average declined to 202,250 from approximately 224,000 in June. Weekly fluctuations remain common, but the broader trend suggests layoffs are becoming less frequent and the labor market remains more stable than recent growth concerns might imply.
Economic and Capital Markets Dashboard
Week Ahead…

This week’s economic calendar will provide investors with an important update on the labor market, business sentiment, and inflation. Following last week’s strong PMI reports and improving jobless claims data, markets will be looking for confirmation that recent optimism is beginning to translate into broader economic activity.
Labor Market: A Closer Look Beneath the Headline
Labor market data will take center stage this week. Tuesday’s Job Openings and Labor Turnover Survey (JOLTS) report will provide additional insight into labor market dynamics, particularly the balance between labor supply and demand. Investors will pay close attention to job openings and the quits rate, as higher voluntary job turnover can indicate workers remain confident in their ability to find new employment opportunities.
The week’s most closely watched release will arrive Friday with the September Employment Report. While nonfarm payrolls and the unemployment rate will receive the greatest attention, markets will also monitor measures such as labor force participation and the broader U-6 unemployment rate for clues about the labor market’s underlying health. Following recent improvements in jobless claims, investors will be looking to see whether payroll growth continues to support the view that labor conditions remain resilient.
Business Sentiment: Looking for Confirmation
Markets will also receive Institute for Supply Management (ISM) Manufacturing and ISM Services data, providing an opportunity to validate the strong S&P Global PMI readings released last week. Particular attention will be paid to whether the ISM surveys reflect a similar improvement in business sentiment across both sectors of the economy.
Confirmation from the ISM reports would strengthen the case that business confidence is improving more broadly rather than being isolated to a single survey provider.
Inflation: Focus Remains on Core PCE
Wednesday’s Core Personal Consumption Expenditures (PCE) report will provide the latest update on inflation trends. Although Core PCE has historically served as the Federal Reserve’s preferred inflation measure, investors may place somewhat less emphasis on the report as policymakers have recently referenced a broader range of inflation indicators. Nevertheless, any meaningful surprise could influence expectations surrounding the future path of monetary policy.
Economic Indicators:
- CPI: Consumer Price Index measures the average change in prices paid by consumers for goods and services over time. Source: Bureau of Labor Statistics.
- Core CPI: Core Consumer Price Index excludes food and energy prices to provide a clearer picture of long-term inflation trends. Source: Bureau of Labor Statistics.
- PPI: Producer Price Index measures the average change in selling prices received by domestic producers for their output. Source: Bureau of Labor Statistics.
- Core PPI: Core Producer Price Index excludes food and energy prices to provide a clearer picture of long-term inflation trends. Source: Bureau of Labor Statistics.
- PCE: Personal Consumption Expenditures measure the average change in prices paid by consumers for goods and services. Source: Bureau of Economic Analysis.
- Core PCE: Core Personal Consumption Expenditures exclude food and energy prices to provide a clearer picture of long-term inflation trends. Source: Bureau of Economic Analysis.
- Industrial Production: Measures the output of the industrial sector, including manufacturing, mining, and utilities. Source: Federal Reserve.
- Mfg New Orders: Measures the value of new orders placed with manufacturers for durable and non-durable goods. Source: Census Bureau.
- Durable New Orders: Measures the value of new orders placed with manufacturers of durable goods. Source: Census Bureau.
- Durable Inventories: Measures the value of inventories held by manufacturers for durable goods. Source: Census Bureau.
- Consumer Confidence (CB, 1985=100): Measures the degree of optimism that consumers feel about the overall state of the economy and their personal financial situation. Source: Conference Board.
- ISM Manufacturing Report: Measures the economic health of the manufacturing sector based on surveys of purchasing managers. Source: Institute for Supply Management.
- ISM Non-Manufacturing Report: Measures the economic health of the non-manufacturing sector based on surveys of purchasing managers. Source: Institute for Supply Management.
- Leading Economic Index: Measures overall economic activity and predicts future economic trends. Source: Conference Board.
- Building Permits (Mil. of Units, saar): Measures the number of new residential building permits issued. Source: Census Bureau.
- Housing Starts (Mil. of Units, saar): Measures the number of new residential construction projects that have begun. Source: Census Bureau.
- New Home Sales (Mil. of Units, saar): Measures the number of newly constructed homes sold. Source: Census Bureau.
- SA: Seasonally adjusted.
- SAAR: Seasonally adjusted annual rate.
Market Indices & Indicators:
- S&P 500: A market-capitalization-weighted index of 500 leading publicly traded companies in the U.S., widely regarded as one of the best gauges of large U.S. stocks and the stock market overall.
- Dow Jones 30: Also known as the Dow Jones Industrial Average, it tracks the share price performance of 30 large, publicly traded U.S. companies, serving as a barometer of the stock market and economy.
- NASDAQ: The world’s first electronic stock exchange, primarily listing technology giants and operating 29 markets globally.
- Russell 1000 Growth: Measures the performance of large-cap growth segment of the U.S. equity universe, including companies with higher price-to-book ratios and growth metrics.
- Russell 1000 Value: Measures the performance of large-cap value segment of the U.S. equity universe, including companies with lower price-to-book ratios and growth metrics.
- Russell 2000: A market index composed of 2,000 small-cap companies, widely used as a benchmark for small-cap mutual funds.
- Wilshire 5000: A market-capitalization-weighted index capturing the performance of all American stocks actively traded in the U.S., representing the broadest measure of the U.S. stock market.
- MSCI EAFE Index: An equity index capturing large and mid-cap representation across developed markets countries around the world, excluding the U.S. and Canada.
- MSCI Emerging Market Index: Captures large and mid-cap representation across emerging markets countries, covering approximately 85% of the free float-adjusted market capitalization in each country.
- VIX: The CBOE Volatility Index measures the market’s expectations for volatility over the coming 30 days, often referred to as the “fear gauge.”
- FTSE NAREIT All Equity REITs: Measures the performance of all publicly traded equity real estate investment trusts (REITs) listed in the U.S., excluding mortgage REITs.
- S&P U.S. Aggregate Bond Index: Represents the performance of the U.S. investment-grade bond market, including government, corporate, mortgage-backed, and asset-backed securities.
- 3-Month T-bill Yield (%): The yield on U.S. Treasury bills with a maturity of three months, reflecting short-term interest rates.
- 10-Year Treasury Yield (%): The yield on U.S. Treasury bonds with a maturity of ten years, reflecting long-term interest rates.
- 10Y-2Y Treasury Spread (%): The difference between the yields on 10-year and 2-year U.S. Treasury bonds, often used as an indicator of economic expectations.
- WTI Crude ($/bl): The price per barrel of West Texas Intermediate crude oil, a benchmark for U.S. oil prices.
- Gold ($/Troy Oz): The price per troy ounce of gold, a standard measure for gold prices.
- Bitcoin: A decentralized digital currency without a central bank or single administrator, which can be sent from user to user on the peer-to-peer bitcoin network.
This content was developed by Cambridge and BridgePort from sources believed to be reliable. This content is provided for informational purposes only and should not be construed or acted upon as individualized investment advice. It should not be considered a recommendation or solicitation. Information is subject to change. Any forward-looking statements are based on assumptions, may not materialize, and are subject to revision without notice. The information in this material is not intended as tax or legal advice.
Investing involves risk. Depending on the different types of investments there may be varying degrees of risk. Socially responsible investing does not guarantee any amount of success. Clients and prospective clients should be prepared to bear investment loss including loss of original principal. Indices mentioned are unmanaged and cannot be invested into directly. Past performance is not a guarantee of future results.
The Dow Jones Industrial Average (DJIA) is a price-weighted index composed of 30 widely traded blue-chip U.S. common stocks. The S&P 500 is a market-cap weighted index composed of the common stocks of 500 leading companies in leading industries of the U.S. economy. The NASDAQ Composite Index is a market-value weighted index of all common stocks listed on the NASDAQ stock exchange.
Securities offered through Cambridge Investment Research, Inc., a broker-dealer, member FINRA/SIPC, and investment advisory services offered through Cambridge Investment Research Advisors, Inc., a Registered Investment Adviser. BridgePort Financial Solutions, LLC is a Registered Investment Adviser with the U.S. Securities & Exchange Commission. All three are wholly-owned subsidiaries of Cambridge Investment Group, Inc. V.CIR.0926-3605